Markets
The Latte Index: Using the Impartial Bean to Value Currencies
The Impartial Bean
Using the price of a coffee to estimate currency value
The Chart of the Week is a weekly Visual Capitalist feature on Fridays.
Like any other market, there are many opinions on what a currency ought to be worth relative to others.
With certain currencies, that spectrum of opinions is fairly narrow. As an example, for the world’s most traded currency – the U.S. dollar – the majority of opinions currently fall in a range from the dollar being 2% to 11% overvalued, according to organizations such as the Council of Foreign Relations, the Bank of International Settlements, the OECD, and the IMF.
For other currencies, the spectrum is much wider. The Swiss franc, which some have called the world’s most perplexing currency, has estimates from those same groups ranging from about 13% undervalued to 21% overvalued.
Such a variance in estimates makes it hard to come up with any conclusive consensus – so in today’s chart, we refer to a more caffeinated and fun measure that also approximates the relative value of currencies.
The Impartial Bean
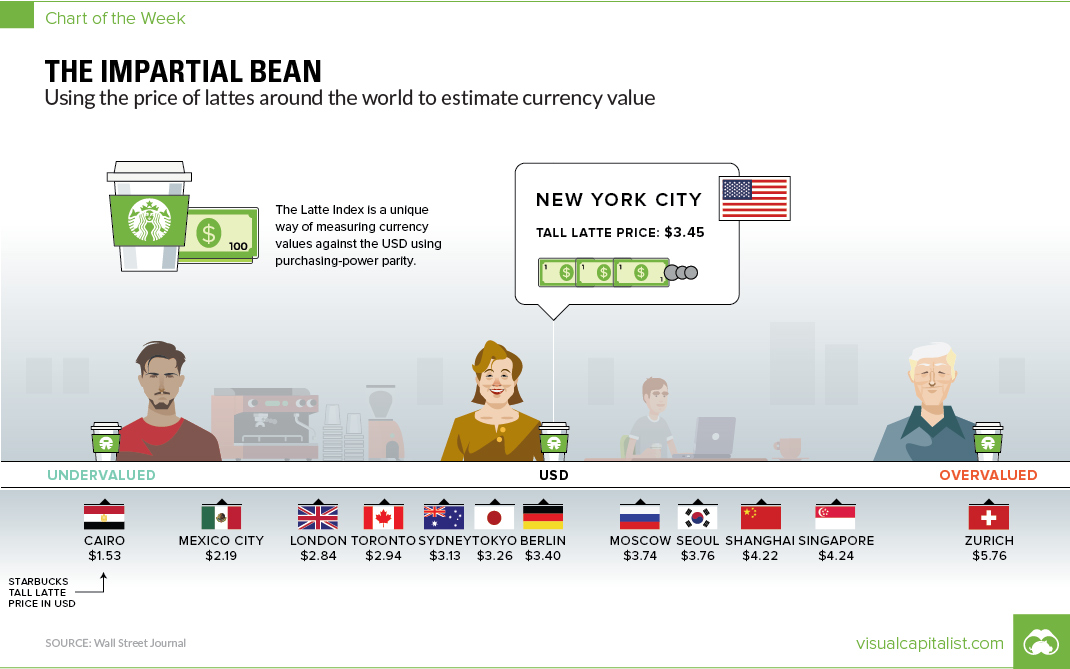
The “Latte Index”, developed by The Wall Street Journal, uses purchasing-power parity (PPP) – comparing the cost of the same good in different countries – to estimate which currencies are overvalued and undervalued.
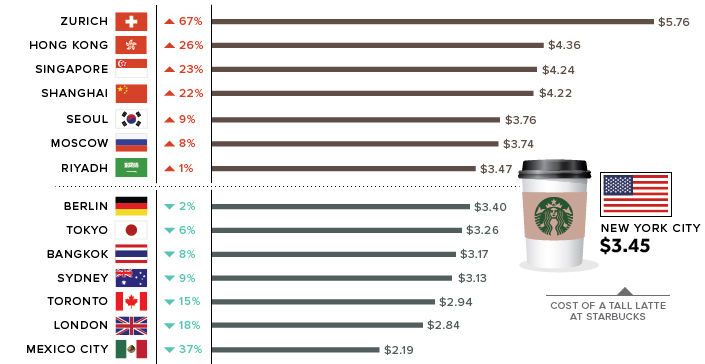
In this case, the WSJ tracked down the price of a tall Starbucks latte in dozens of cities around the world. These prices are then converted to U.S. dollars and compared to the benchmark price, which is a tall Starbucks latte in New York City (US$3.45).
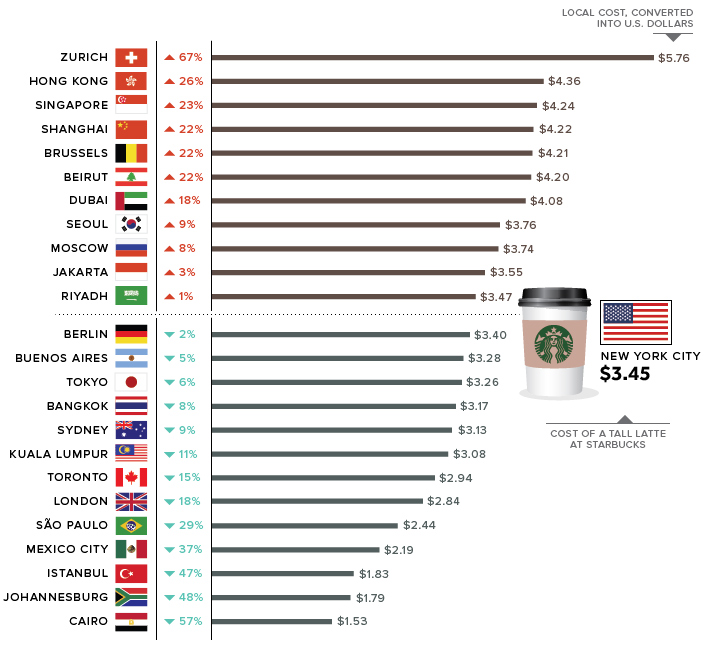
The Latte Index is mostly for fun, but it’s also broadly in line with predictions made by the experts.
For example, the price of a latte in Toronto, Canada works out to US$2.94, which is about 14.8% under the benchmark NYC price. This suggests that relative to the USD, the Canadian dollar is undervalued. Interestingly, estimates from the aforementioned sources (BIS, OECD, CFR, IMF) have the Canadian dollar at being up to 10% undervalued – which puts the Latte Index not too far off.
Given the wild range of estimates that exist for currency values, using the relative cost of a cup of joe might be as good of a proxy as any.


Maps
Mapped: The 10 U.S. States With the Lowest Real GDP Growth
In this graphic, we show where real GDP lagged the most across America in 2023 as high interest rates weighed on state economies.


The Top 10 U.S. States, by Lowest Real GDP Growth
This was originally posted on our Voronoi app. Download the app for free on iOS or Android and discover incredible data-driven charts from a variety of trusted sources.
While the U.S. economy defied expectations in 2023, posting 2.5% in real GDP growth, several states lagged behind.
Last year, oil-producing states led the pack in terms of real GDP growth across America, while the lowest growth was seen in states that were more sensitive to the impact of high interest rates, particularly due to slowdowns in the manufacturing and finance sectors.
This graphic shows the 10 states with the least robust real GDP growth in 2023, based on data from the Bureau of Economic Analysis.
Weakest State Economies in 2023
Below, we show the states with the slowest economic activity in inflation-adjusted terms, using chained 2017 dollars:
| Rank | State | Real GDP Growth 2023 YoY | Real GDP 2023 |
|---|---|---|---|
| 1 | Delaware | -1.2% | $74B |
| 2 | Wisconsin | +0.2% | $337B |
| 3 | New York | +0.7% | $1.8T |
| 4 | Missississippi | +0.7% | $115B |
| 5 | Georgia | +0.8% | $661B |
| 6 | Minnesota | +1.2% | $384B |
| 7 | New Hampshire | +1.2% | $91B |
| 8 | Ohio | +1.2% | $698B |
| 9 | Iowa | +1.3% | $200B |
| 10 | Illinois | +1.3% | $876B |
| U.S. | +2.5% | $22.4T |
Delaware witnessed the slowest growth in the country, with real GDP growth of -1.2% over the year as a sluggish finance and insurance sector dampened the state’s economy.
Like Delaware, the Midwestern state of Wisconsin also experienced declines across the finance and insurance sector, in addition to steep drops in the agriculture and manufacturing industries.
America’s third-biggest economy, New York, grew just 0.7% in 2023, falling far below the U.S. average. High interest rates took a toll on key sectors, with notable slowdowns in the construction and manufacturing sectors. In addition, falling home prices and a weaker job market contributed to slower economic growth.
Meanwhile, Georgia experienced the fifth-lowest real GDP growth rate. In March 2024, Rivian paused plans to build a $5 billion EV factory in Georgia, which was set to be one of the biggest economic development initiatives in the state in history.
These delays are likely to exacerbate setbacks for the state, however, both Kia and Hyundai have made significant investments in the EV industry, which could help boost Georgia’s manufacturing sector looking ahead.

-

 United States6 days ago
Mapped: Countries Where Recreational Cannabis is Legal
-

 Healthcare2 weeks ago
Life Expectancy by Region (1950-2050F)
-

 Markets2 weeks ago
The Growth of a $1,000 Equity Investment, by Stock Market
-

 Markets2 weeks ago
Mapped: Europe’s GDP Per Capita, by Country
-

 Money2 weeks ago
Charted: What Frustrates Americans About the Tax System
-

 Technology2 weeks ago
Countries With the Highest Rates of Crypto Ownership
-

 Mining2 weeks ago
Where the World’s Aluminum is Smelted, by Country
-

 Personal Finance1 week ago
Visualizing the Tax Burden of Every U.S. State